 dEdge
If the Wallet Finder is your radar, Curated Wallets are your shortcuts: ready-made lists of traders who meet strict performance thresholds, selected by the dEdge team and AI.
What are Curated Wallets?
Curated Wallets aren’t random picks. They’re filtered by numbers:
- Minimum Win Rate (e.g., +55% over last 30 days)
- Positive Net PnL (wallet must be net profitable)
- PnL Ratio above 1.5 (trades are efficient, not just lucky)
- Consistent Trade History (enough sample size, not a single lucky hit)
- Minimum Trading Deltas (traders trading pace has a minimum length so they’re more practical to evaluate for copying, without guaranteeing matching execution)
The goal: remove noise and give you clusters of wallets that actually pass performance tests.
Why this matters
When you scroll raw wallets, you risk:
❌ Following short-term luck (PnL spike with only 2 trades).
❌ Chasing “whales” that aren’t consistently efficient.
❌ Copying High-Frequency Traders which is an impossible infrastructure task
Curated Wallets solve this by enforcing quantitative criteria:
- Time saved → Narrow the wallets you review using explicit criteria.
- Statistical consistency → Review historical consistency without assuming future reliability.
- Portfolio thinking → Compare groups of wallets with different profiles (scalpers, swing traders, whales).
How to use Curated Wallets
1. Open the dEdge bot on Telegram: https://t.me/dEdge_solana_bot?start=academy
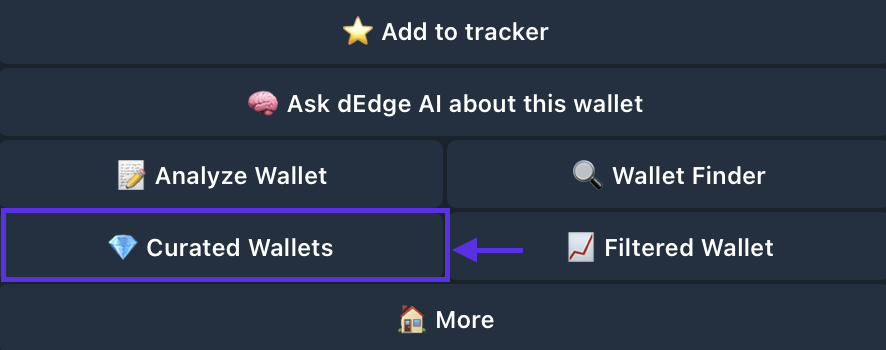
2. Tap Curated Wallets.
3. Review the metrics→ each set is backed by filters like Win Rate, Net Sol, and Avg. Trade Size.
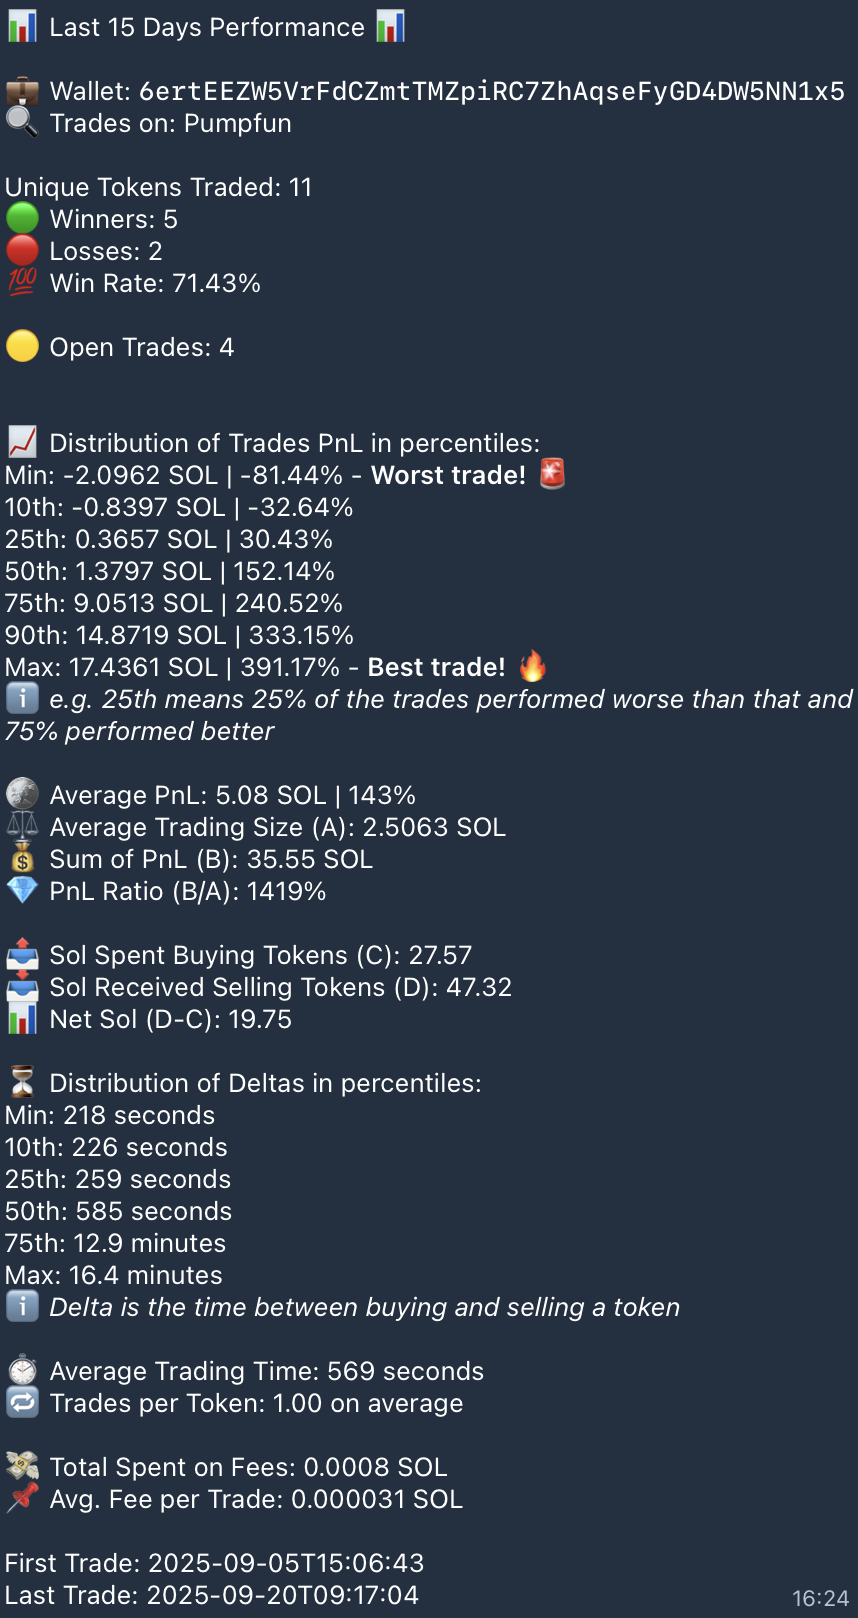
This wallet has been active for the last 15 days, and the numbers are already telling a strong story. Let’s simplify the main metrics:
✅ Performance Overview
- Win Rate: 71.4% (5 wins, 2 losses)
- PnL (Profit & Loss): +35.55 SOL total
- Net Sol: +19.75 SOL after costs
Trade Quality (PnL Percentiles)
- Worst trade: -2.09 SOL (-81%).
- Best trade: +17.43 SOL (+391%).
- Average per trade: +5.08 SOL (+143%).
Losses exist (as always), but the wins are much larger — this is a positive risk/reward profile.
Trading Style (Deltas & Time)
- Average hold time: ~9.5 minutes (569 seconds).
- Fastest trade: ~3.6 minutes.
- Longest trade: 16 minutes.
This looks like a high-frequency, short-term scalper style: enter, take profit, and exit fast.
Costs (Fees)
- Total fees: 0.0008 SOL → negligible compared to gains.
- PnL Ratio (B/A): 1419% efficiency.
Fees are almost irrelevant here — efficiency is extremely high.
🎯 Simple Conclusion
This wallet shows short-term aggressive trading, with a strong positive expectancy: wins are bigger than losses, the average PnL is impressive, and costs don’t eat into profits.
It’s a clear example of why following metrics matters: raw win rate alone (71%) doesn’t tell the whole story — the real edge comes from the size of wins vs. losses.
⚡️ Next article preview:
In a deeper dive, we’ll break down how to use metrics like percentiles, PnL ratio, and Net Sol to evaluate if a wallet is truly worth copying — and how to spot when consistency breaks down.
💡 dEdge Academy Tip
Start with a Curated List, but don’t stop there. Cross-check wallets with:
- PnL Percentiles → to test consistency.
- Delta → to see average holding time.
- Fees impact → small costs kill aggressive traders faster.
By layering quantitative filters + your own analysis, you build conviction in which wallets to track or copy.
Put the context to work.
Start with a free public wallet report. Look at the analysis window, the returns and the details.
Research a wallet ↗