Curated Wallets: Data-Backed Shortcuts to Profitable Traders
If the Wallet Finder is your radar, Curated Wallets are your shortcuts: ready-made lists of traders who meet strict performance thresholds, selected by the dEdge team and AI.
What are Curated Wallets?
Curated Wallets aren’t random picks. They’re filtered by numbers:
- Minimum Win Rate (e.g., +55% over last 30 days)
- Positive Net PnL (wallet must be net profitable)
- PnL Ratio above 1.5 (trades are efficient, not just lucky)
- Consistent Trade History (enough sample size, not a single lucky hit)
- Minimum Trading Deltas (traders trading pace has a minimum length so they’re 100% copyable from a bot standpoint)
The goal: remove noise and give you clusters of wallets that actually pass performance tests.
Why this matters
When you scroll raw wallets, you risk:
❌ Following short-term luck (PnL spike with only 2 trades).
❌ Chasing “whales” that aren’t consistently efficient.
❌ Copying High-Frequency Traders which is an impossible infrastructure task
Curated Wallets solve this by enforcing quantitative criteria:
- Time saved → Skip 90% of irrelevant wallets.
- Statistical consistency → Follow wallets that already proved reliability.
- Portfolio thinking → Compare groups of wallets with different profiles (scalpers, swing traders, whales).
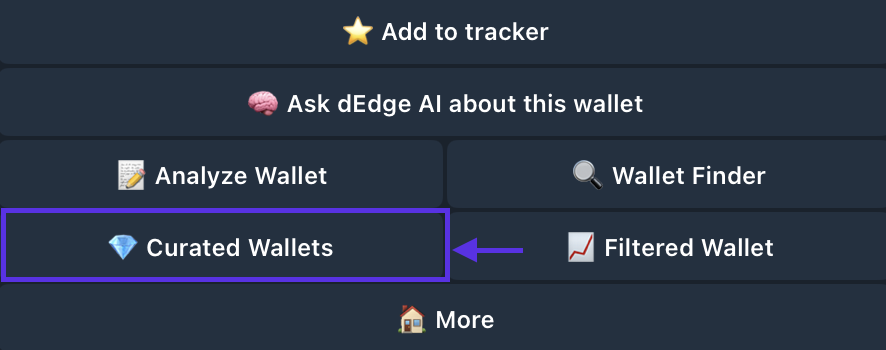
How to use Curated Wallets
2. Tap Curated Wallets.
3. Review the metrics→ each set is backed by filters like Win Rate, Net Sol, and Avg. Trade Size.
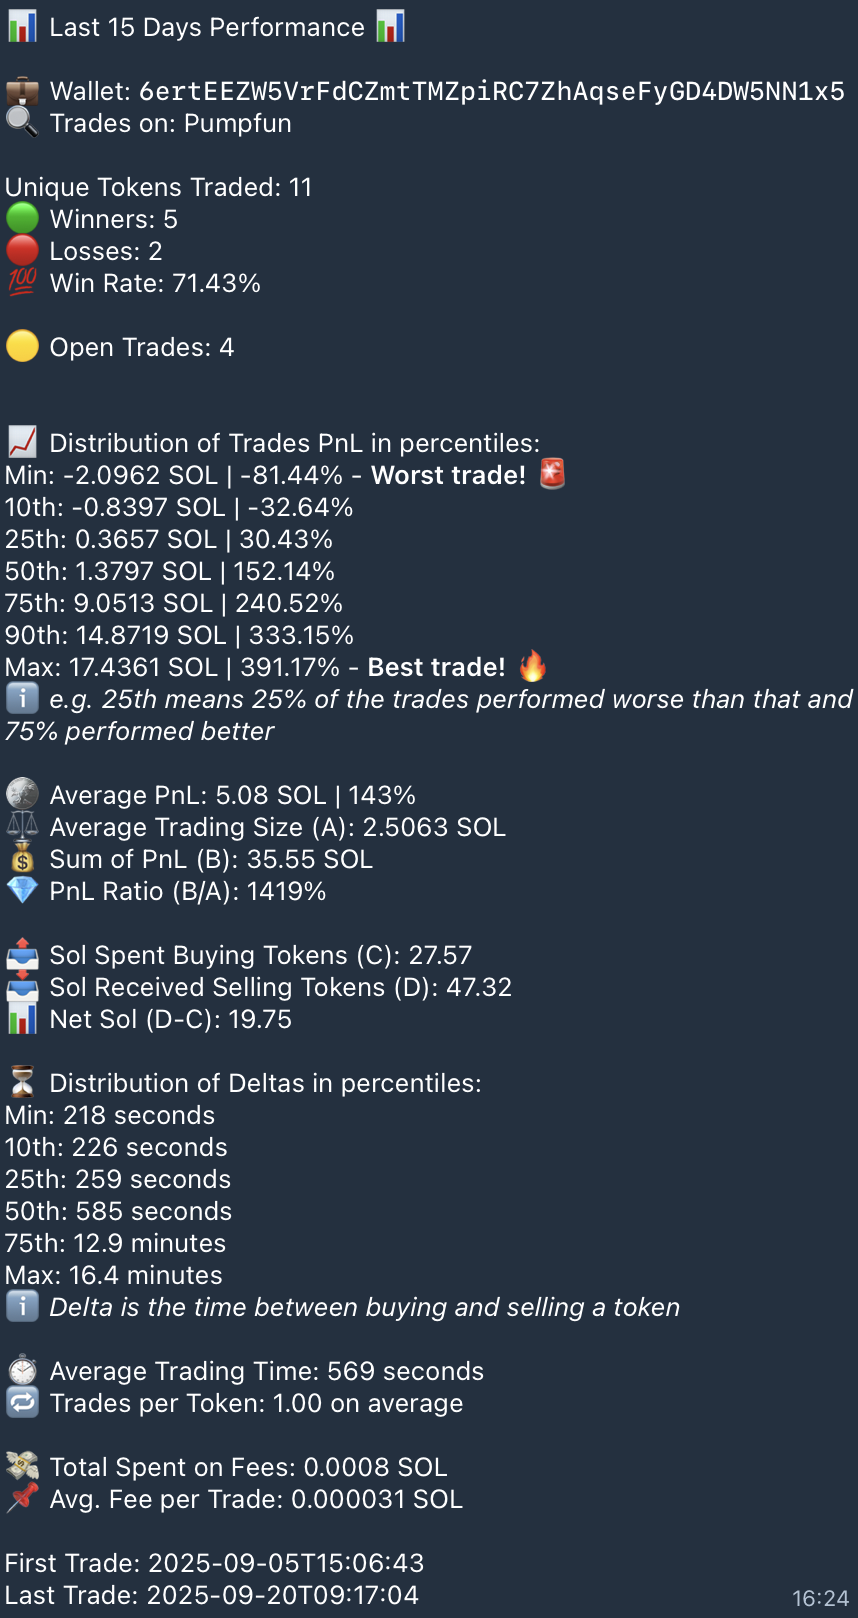
📊 Quick Quantitative Look:
This wallet has been active for the last 15 days, and the numbers are already telling a strong story. Let’s simplify the main metrics:
✅ Performance Overview
- Win Rate: 71.4% (5 wins, 2 losses)
- PnL (Profit & Loss): +35.55 SOL total
- Net Sol: +19.75 SOL after costs
Trade Quality (PnL Percentiles)
- Worst trade: -2.09 SOL (-81%).
- Best trade: +17.43 SOL (+391%).
- Average per trade: +5.08 SOL (+143%).
Losses exist (as always), but the wins are much larger — this is a positive risk/reward profile.
Trading Style (Deltas & Time)
- Average hold time: ~9.5 minutes (569 seconds).
- Fastest trade: ~3.6 minutes.
- Longest trade: 16 minutes.
This looks like a high-frequency, short-term scalper style: enter, take profit, and exit fast.
Costs (Fees)
- Total fees: 0.0008 SOL → negligible compared to gains.
- PnL Ratio (B/A): 1419% efficiency.
Fees are almost irrelevant here — efficiency is extremely high.
🎯 Simple Conclusion
This wallet shows short-term aggressive trading, with a strong positive expectancy: wins are bigger than losses, the average PnL is impressive, and costs don’t eat into profits.
It’s a clear example of why following metrics matters: raw win rate alone (71%) doesn’t tell the whole story — the real edge comes from the size of wins vs. losses.
⚡️ Next article preview:
In a deeper dive, we’ll break down how to use metrics like percentiles, PnL ratio, and Net Sol to evaluate if a wallet is truly worth copying — and how to spot when consistency breaks down.
💡 dEdge Academy Tip
Start with a Curated List, but don’t stop there. Cross-check wallets with:
- PnL Percentiles → to test consistency.
- Delta → to see average holding time.
- Fees impact → small costs kill aggressive traders faster.
By layering quantitative filters + your own analysis, you build conviction in which wallets to track or copy.